Being a psychic medium and able to spontaneously speak indigenous languages, Janet was curious what type of brain activity takes place while conducting readings and channeling the languages. She met Dr. Jeff Tarrant through a mutual acquaintance and they began an experiment on mapping her brain over a two and a half year period. The findings below suggest Janet consistently shows unusual brainwave activity while engaged in her practice.

Screen capture of meditation, eyes open. Janet was receiving a lot of disjointed information during this meditation, much of it with strong emotional content (car accident, bank robbery, earthquake). It was noted that she began writing as soon as electric discharges became more active (see P4 and O2 on above screen shot)
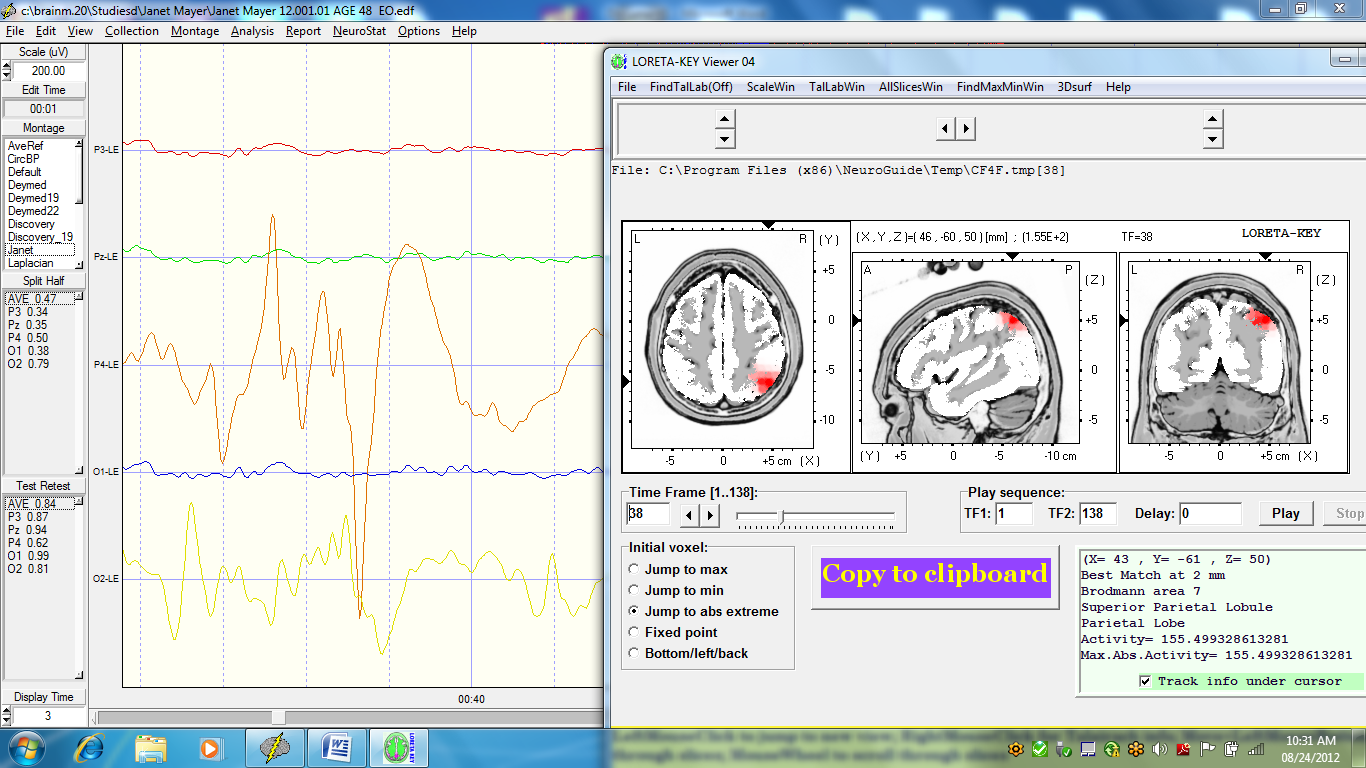
This is a sample of the above recorded with a LORETA analysis of the highest point, time series 11. This shows that the source of the burst is in BA 7, the superior parietal lobule.
When a Carmelite nun prays to “God”, there is significant neural activity in the: “…right medial orbitofrontal cortex, right middle temporal cortex, right inferior and superior parietal lobes” (Beauregard and Paquette 2006, 186). Notably, the superior parietal lobe is utilized for spatial perception of the self; when this region is activated, the believer feels like they’re in the presence of something greater than themselves.
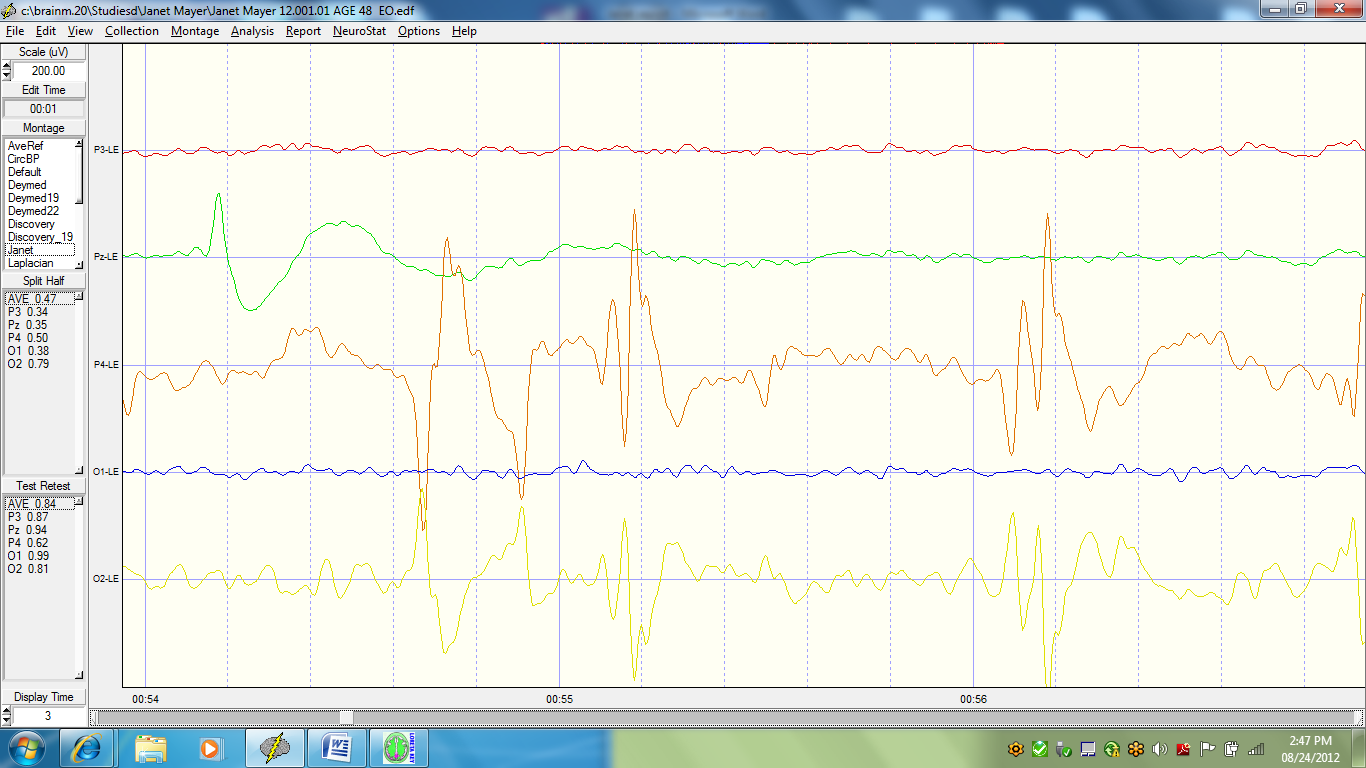
Same recording, just another sample, showing a traditional spike/wave at PZ with other activity at P4 and O2.
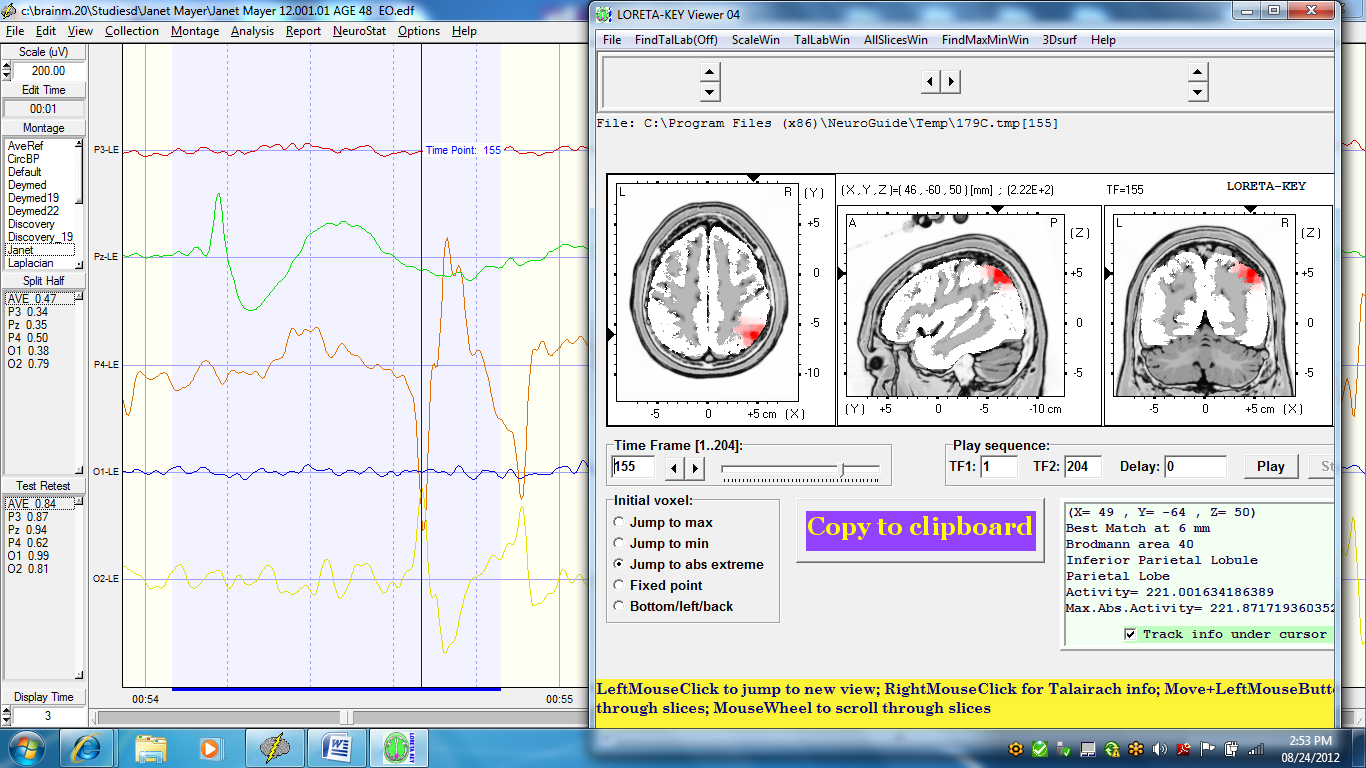
Source of PZ activity is BA 7, same as P4 activity. Source of O2 is BA 40 as shown in this screen, inferior parietal lobule.
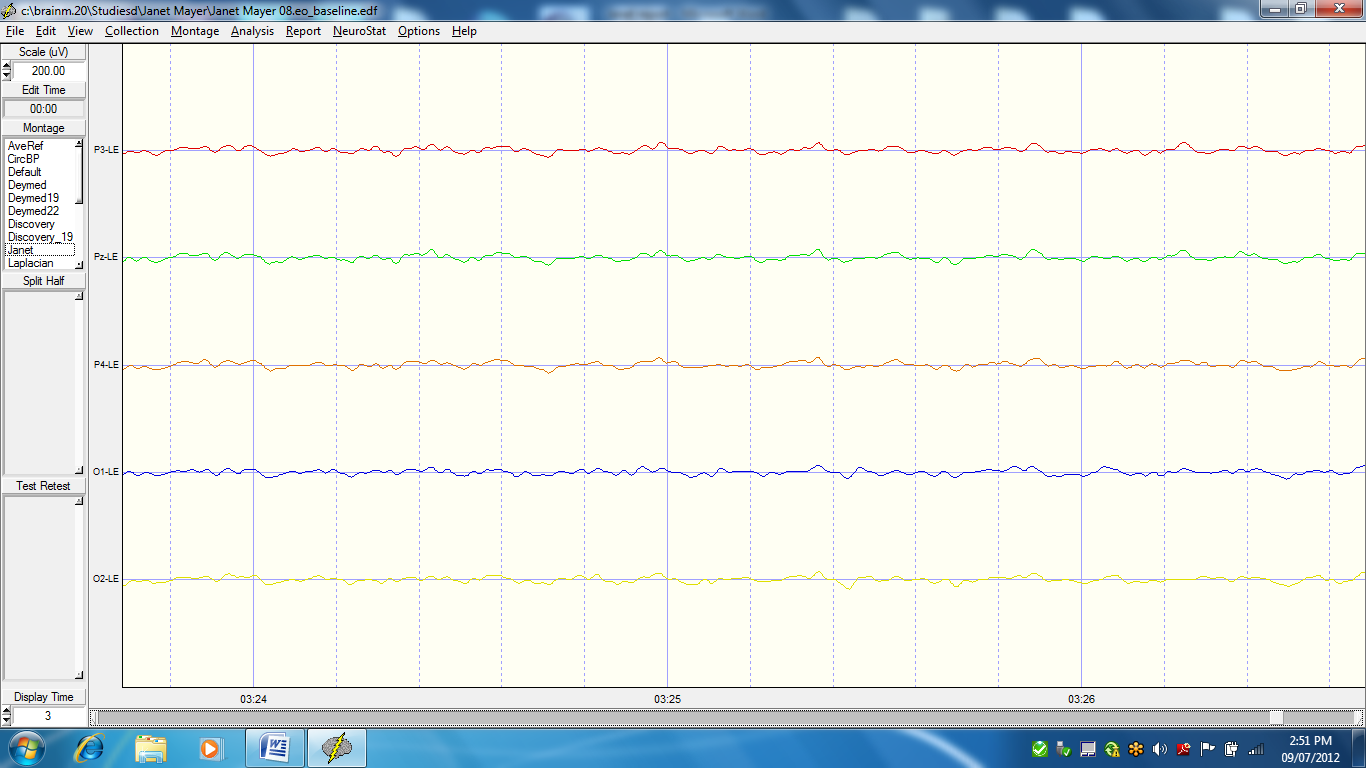
EO recording, typical segment at 200 mv scale
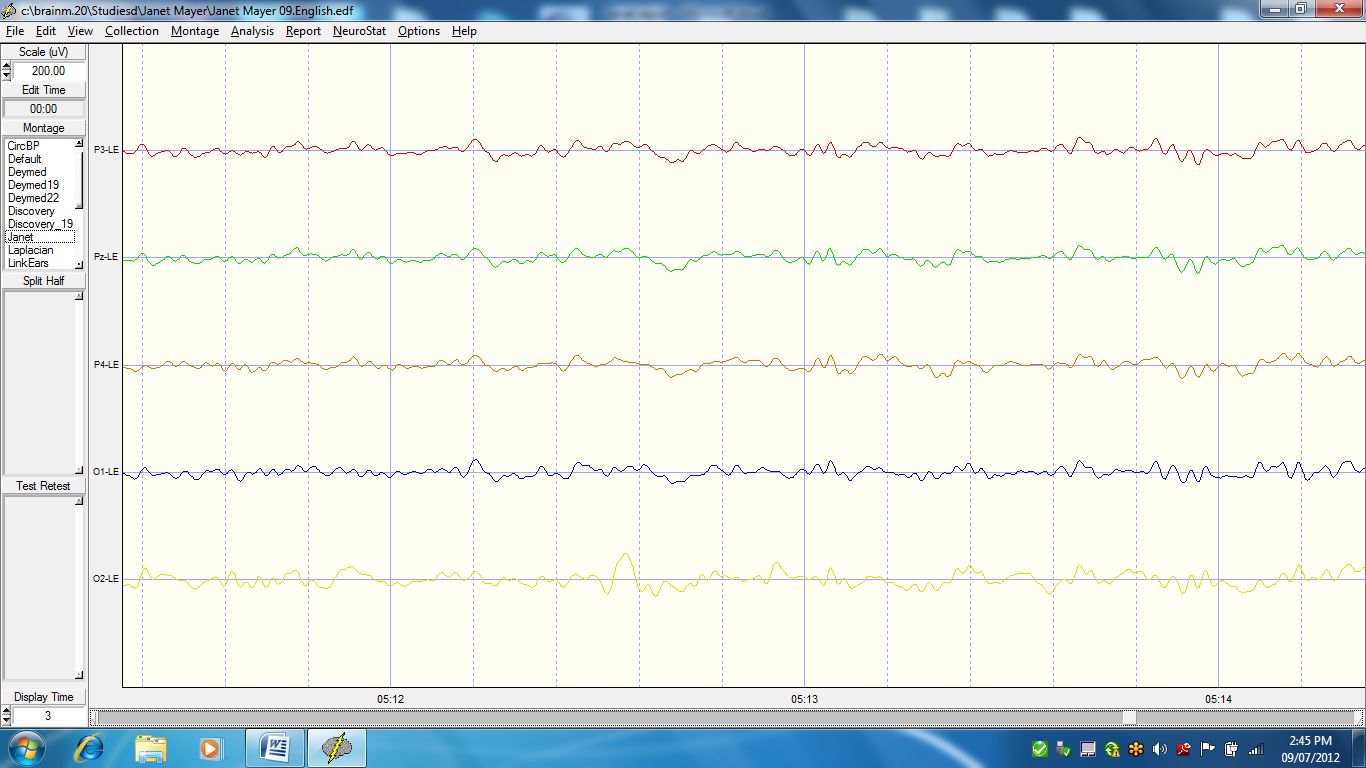
Typical segment of recording while speaking English with Scale at 200mv
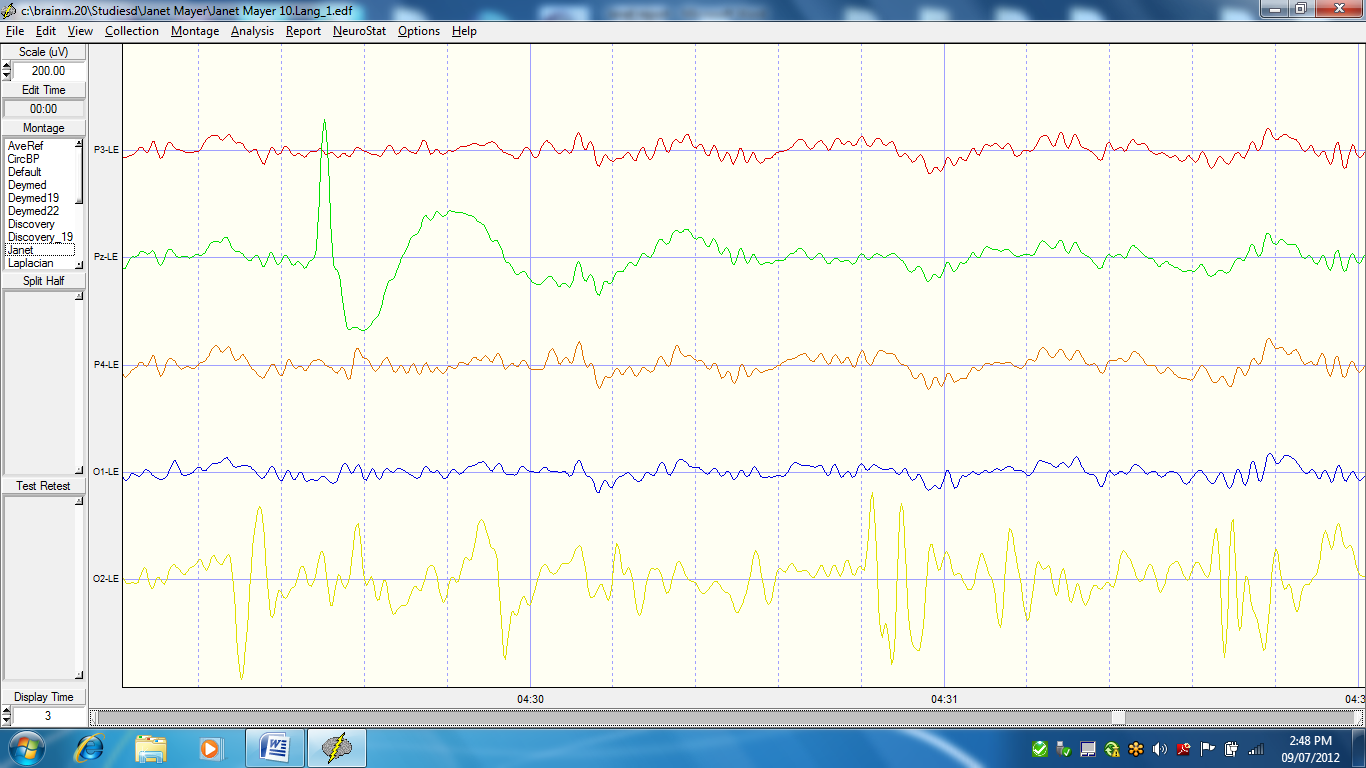
First language recording at 200mv scale.

This was the second language recording, showing the ramping up of activity at PZ which stayed very irregular and inconsistent throughout. Notice scale at 400 mv.
The explanation below has been included for the video above.
At the beginning of this session, you can see the raw EEG of all 19 channels on the screen and the waves are all behaving more or less as would be expected. You can see a couple very small “blips” in the EEG at areas T6 and P4, areas next to each other in the right temporal/parietal junction. When the EEG begins to look very messy this is because one or more of the areas measured has become extremely large-larger than the scale that is measuring it. I change the screen to only show 4 channels (rather than 19). This enables us to see things a little more clearly. The lowest channel on the screen is P4, which corresponds to the right back corner of the head and is often where we see atypical activity with you when you are speaking the languages. You can see very large spikes of activity that would normally be considered a bad connection. However, you will notice that when Janet laughs and starts speaking English for a moment that line normalizes for a short time without any adjustment to the cap. Around the time she begins speaking the languages again, that area becomes very activated. The activity shown is predominately slow wave activity, suggesting that area is “off line.” This would be a safe interpretation if this were looked at as seizure activity or huge activation of slow activity.
When I change the screen again this is using the sLORETA viewer from BrainMaster Avatar software to show the activation of individual voxels. Initially, we are only looking at theta activity (a slow wave between 4-8 hz). Brighter colors suggested increased activity of this band. You will consistently see bright red colors on the rear right side. You will also see red in the frontal areas (the top of the screen). This is most likely eye movement and eye blinks so cannot be considered “real.” Toward the end of the session, I change the band we are looking at to delta (1-4 hz). This is even slower activity. Again, highlighting the huge increases in these slow brain waves in that specific area of the brain. This pattern is super consistent with Janet. While it is not always exactly at P4, it is always in the same region.
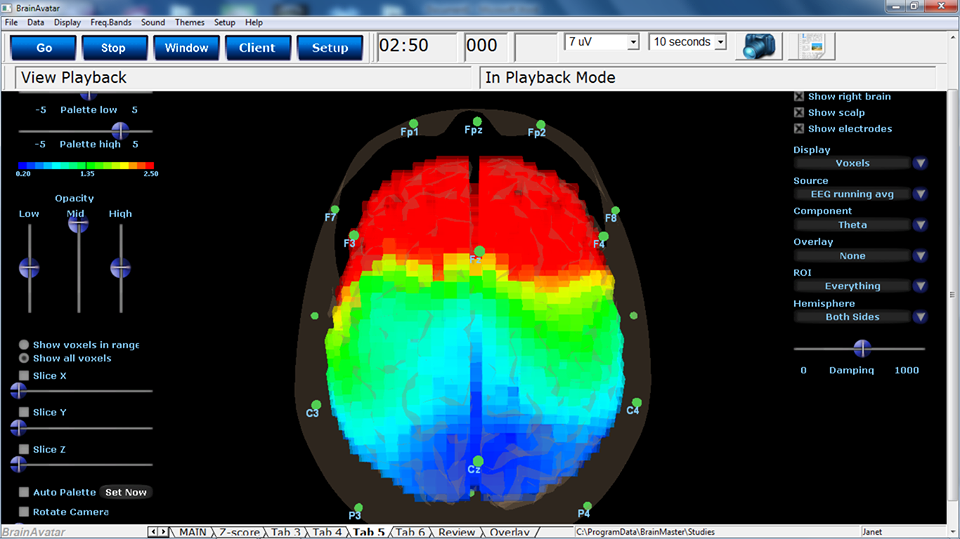
Image taken of Janet Mayer’s brainwaves during speaking English, showing theta activity. Frontal areas show most activity due to muscle movement (artifact). Notice the lack of activity in the back of the head, indicated by the “cool” colors of deep blue.
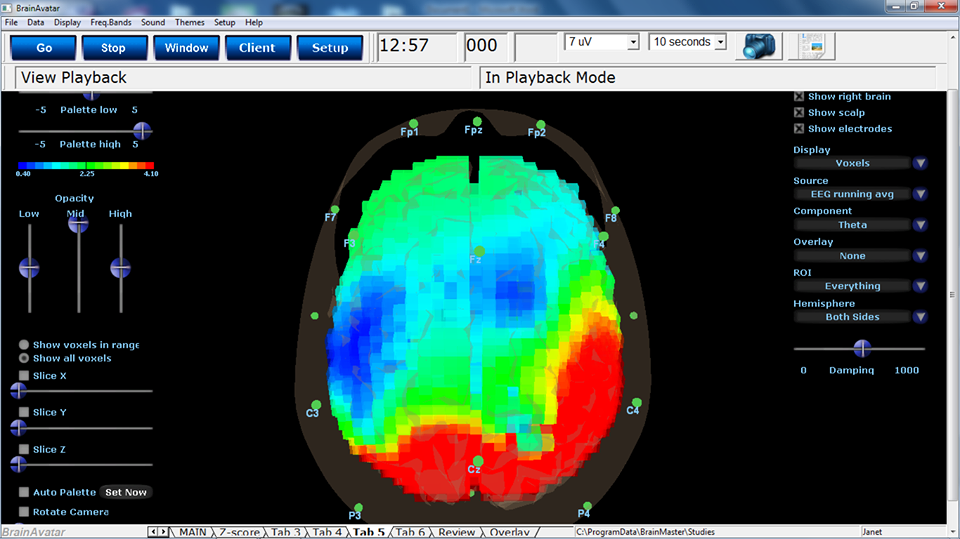
Good example of brainwave activity of Janet Mayer while speaking the channeled indigenous languages. Notice how the back, right part of the brain is the most active in theta wave activity, while the frontal lobes are relatively quiet. All EEG images on this page and test conducted by Dr. Tarrant with Janet Mayer.
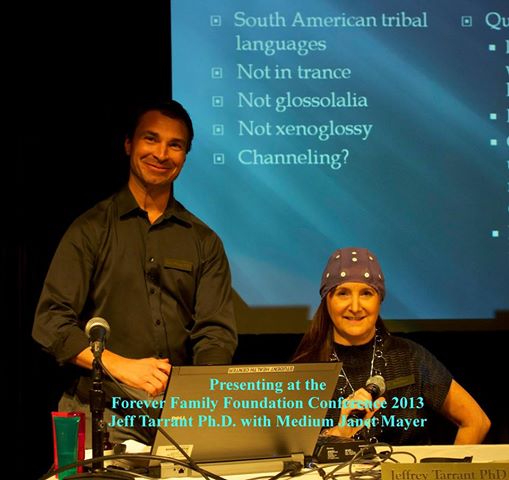
Taken @ the Forever Family Foundation Conference 2013 in San Diego, with Dr. Tarrant as he demonstrates the changes in brainwave patterns while channeling the South American indigenous languages.
Whether you consider this as proof or not that Janet is communicating with deceased loved ones and Spirits from the Rainforest, you can’t help but acknowledge something extremely unusual is taking place while engaged in her practice.